Plain answer
An index combines selected securities according to published weighting and adjustment rules. In a free-float market-capitalisation-weighted index, included market value determines influence, while a divisor keeps the scale comparable. Index points are a measure, not your cash return.
A stock-market index is a calculation built from a selected group of securities. Its rules decide what belongs in the group, how much influence each security has, and how the measure stays comparable when the group changes. The headline number is the end of that process.
This matters whenever a news report says “the market rose”, or a fund says it tracks an index. Which market? Which companies? Which weighting? A benchmark can be useful without being a complete picture of the economy or of your investments.
Start with membership and weighting
An index administrator publishes a methodology: a set of selection and calculation rules. Membership may depend on factors such as listing, size, tradability or the market the index aims to represent. The companies included are called constituents. A share being familiar does not, by itself, make it eligible.
Weighting determines how much each constituent contributes. In a market-capitalisation-weighted index, larger included market values generally carry greater influence. Market capitalisation means share price multiplied by the relevant number of shares. A £20 share is not necessarily part of a larger company than a £2 share: the number of shares matters too.
The FTSE UK calculation guide describes its price indices using free-float-adjusted market values divided by a divisor. Free float adjusts the counted shares for holdings the methodology treats as unavailable to ordinary public investors. The free-float lesson explains why this is a rules-based measure, not a count of shares offered for sale today.
Other indices use other approaches, including equal weights or weights based on share prices. “An index” is therefore not one universal recipe. Read the methodology for the named version before interpreting what its movement represents.
Build a fictional three-company index
Our example uses invented companies, all priced in pounds. It is designed to make the arithmetic visible, not reproduce the FTSE 100. We ignore foreign exchange, taxes, costs and corporate actions initially. Share quantities are stated in millions.
- Alder: share price £4; 100 million shares; free-float factor 75%. Included market value: £4 × 100 million × 0.75 = £300 million.
- Birch: share price £10; 20 million shares; free-float factor 50%. Included market value: £10 × 20 million × 0.50 = £100 million.
- Cedar: share price £2; 100 million shares; free-float factor 50%. Included market value: £2 × 100 million × 0.50 = £100 million.
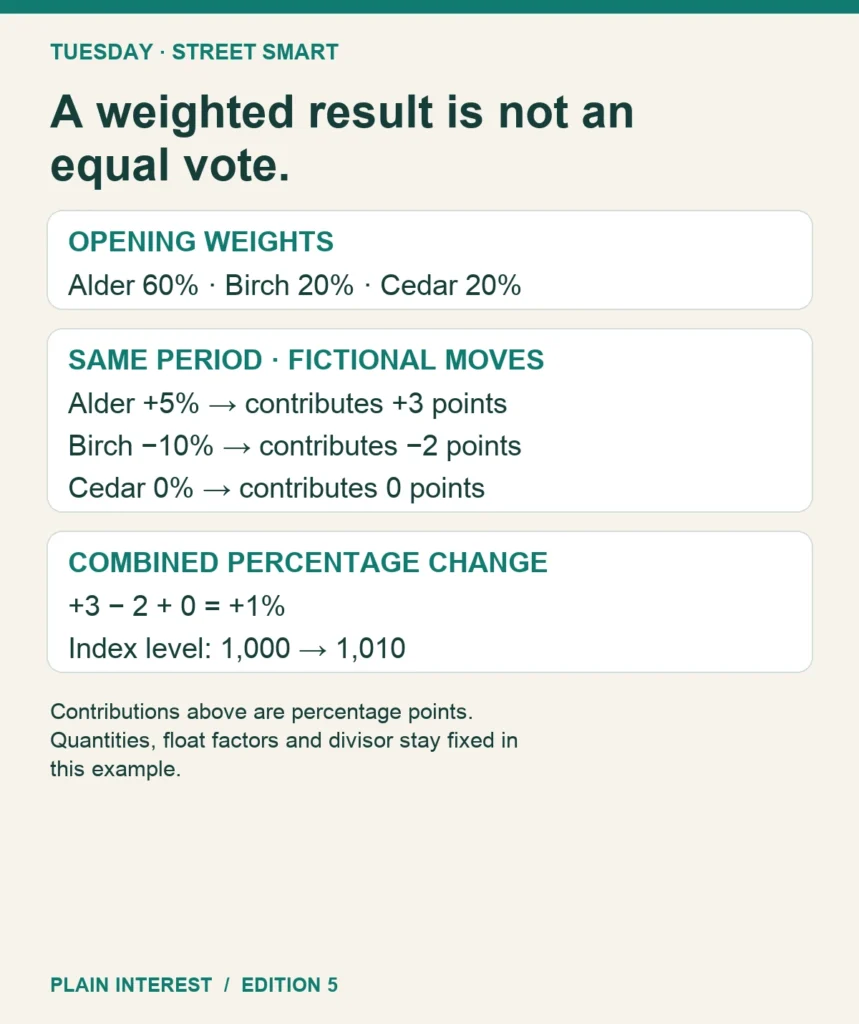
The total included market value is £500 million. Alder therefore begins with a 60% weight, while Birch and Cedar each have 20%. Birch has the highest individual share price but only one-third of Alder’s weight. That is the distinction between an expensive-looking share and a large weighted contribution.
The float factors are assumptions for this exercise. They are not claims about real companies or estimates of live liquidity. Every input needed to reproduce the calculation is shown, so the result does not depend on trusting an unexplained score.
Turn market value into index points
We choose 1,000 as the starting index level. That starting number is a scale, not an amount of money an investor owns. To obtain it, divide the £500 million included value by 1,000. The resulting divisor is £500,000 per index point.
Now suppose Alder rises 5%, Birch falls 10%, and Cedar does not move. Their new share prices are £4.20, £9 and £2 respectively. Keeping quantities and float factors unchanged, the included values become £315 million, £90 million and £100 million.
The new total is £505 million. Divide it by the unchanged £500,000 divisor and the index becomes 1,010. It has gained 10 points, or 1% of its initial 1,000 level.
You can check the same answer through starting weights: 60% × 5% contributes 3 percentage points; 20% × minus 10% contributes minus 2 percentage points; Cedar contributes zero. Together they produce a 1% index return. This shortcut works here because the calculation holds the other inputs fixed.
An unweighted average of the three share-price changes would be minus 1.67%, approximately. That is a different answer to a different question. It gives each company one equal vote, whereas our index gives Alder more influence. Neither arithmetic result changes the underlying price moves.
An index can rise while many shares fall
The fictional result already shows why a headline can feel at odds with individual holdings. Alder’s positive contribution more than offsets Birch’s fall. In a much larger weighted index, a handful of large constituents can similarly outweigh many smaller moves.
Counting how many constituents rise and fall gives a breadth measure: it describes how widespread a move is. The weighted index describes something else. Seeing those measures disagree is a reason to examine the weights, not automatically evidence that one measure is wrong.
Weights also change as prices move. After our price changes, Alder represents £315 million divided by £505 million, approximately 62.38% of the included value. Its starting weight was 60%. Our contribution calculation used the starting weights; using the new weights retrospectively would answer the wrong calculation.
This is useful when someone says a fund owns “hundreds of companies”. The count alone does not tell you how evenly exposure is spread. A long membership list can coexist with substantial concentration in its largest holdings.
Why the divisor sometimes changes
Suppose, at the original 1,000-point starting position, a qualifying share issue adds £50 million to our included market value without any market-price movement. Simply retaining the £500,000 divisor would make the index jump to 1,100. It would appear to report a 10% market gain even though our example specified none.
To preserve continuity, this simplified example changes the divisor to £550 million divided by 1,000, or £550,000 per point. The index remains 1,000 at that adjustment. Subsequent price movements then change it from the new basis.
Real administrators specify how different corporate actions and membership changes are handled, including their timing. Not every event requires the same adjustment. A share split, for example, can increase the number of shares while proportionately reducing the price, leaving market value unchanged. The general purpose is to keep a change in measurement from masquerading as investment performance.
A divisor is therefore a scaling and continuity device. It is not an extra company, a dealing fee or a mysterious discretionary forecast. The method determines when and how it changes.
Price return and total return are different versions
A price index measures price movements under its rules. A total-return version also accounts for distributions, normally on a specified reinvestment basis. Gross and net total-return versions can make different tax assumptions. Two charts with similar names may consequently be measuring different things.
Consider a separate simplified holding worth £100 at the start and £103 at the end, with a £2 cash distribution paid at the end. Its price gain is 3%. Including that distribution gives a 5% holding-period return before costs and taxes. A real total-return index handles payment dates and reinvestment through its own methodology.
For a fair comparison, check the complete index name, currency, return version and dates. Comparing a fund’s return including reinvested income with a price-only benchmark can make the fund look better for a purely definitional reason.
Index points are not your cash profit
An index reaching 8,000 instead of 4,000 does not tell you it is twice as expensive as another index. They may have different starting dates, initial scales, constituents and methodologies. Percentage changes on a comparable basis are more informative than comparing raw point levels.
You also cannot own a calculation directly. An index fund or other product provides exposure intended to track it, with its own costs, execution, tax treatment and tracking differences. Your cash outcome additionally depends on when you bought, sold or added money. The financial-markets foundation explains the distinction between market measures and transactions.
Before using an index headline, identify the membership rules, weighting method, largest weights and return version. Then ask whether that benchmark represents the holdings or question you actually care about. The next step is to examine how a trading position turns a market movement into a financial gain or loss.