Plain answer
Free float is the proportion of issued shares an index methodology deems readily tradable rather than strategically or otherwise restricted. It is useful context for supply, but it is not a live count of shares offered today and it is not the same as market capitalisation or daily liquidity.
A company can have 100 million shares in issue without anything close to 100 million being readily available to trade. Some shares may sit with founders, governments, controlling companies or other long-term holders. Others may be locked up or restricted.
Free float tries to separate the shares an index methodology deems available to public investors from holdings that are strategic or constrained. It is useful, but it is not a live photograph of the order book.
Plain Interest’s small-cap definition explains what market capitalisation measures. The next step is to ask how much of that company value is represented by shares that can realistically circulate among public investors.
Three numbers answering three questions
Issued shares
Issued shares are the shares the company has created and issued, subject to the accounting and legal definitions in its disclosures. The number helps divide ownership and earnings, but it does not say who holds the shares or whether they intend or are permitted to sell.
Market capitalisation
Market capitalisation is commonly calculated as share price multiplied by shares outstanding. If a fictional company has 100 million shares and a £2 price, its full market capitalisation is £200 million. That number values the equity at the latest price; it does not mean £200 million could be sold at that price.
Free float
Free float is a methodology-based estimate of the share proportion available to public investors. FTSE Russell describes free float as the percentage of shares deemed available for public investment. Its rules identify restrictions and strategic holdings that are excluded or adjusted.
If the fictional company has a 60% investability weighting, its free-float-adjusted market capitalisation is £120 million: 100 million shares × £2 × 0.60. This adjusted figure can be used when a market-capitalisation-weighted index determines the company’s weight. It still does not measure today’s trading volume.
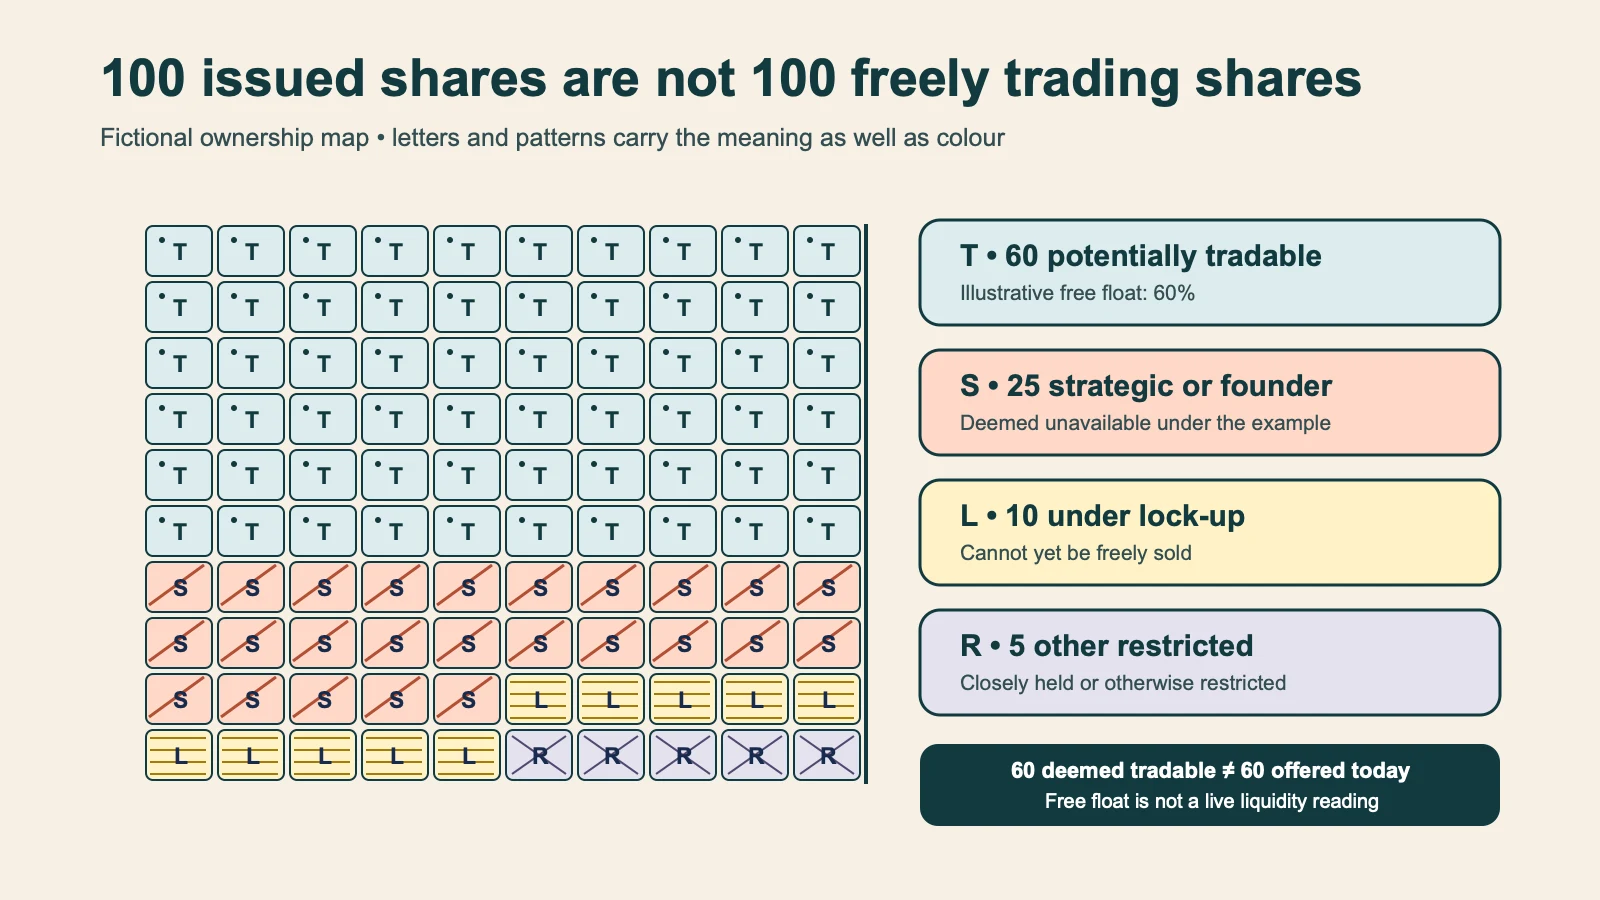
The 100-share ownership map
The diagram treats each square as one issued share in a fictional company:
- T — 60 potentially tradable: holdings the example methodology deems available to public investors.
- S — 25 strategic or founder: holdings treated as strategic rather than part of the public float.
- L — 10 under lock-up: holdings that cannot yet be freely sold under the example.
- R — five other restricted: closely held or otherwise restricted shares.
The letters and patterns repeat the colour coding so the distinction survives in greyscale and at mobile width. More importantly, the map separates two ideas that are often collapsed: being deemed tradable under a methodology and actually being offered at a usable price now.
What can be excluded from free float?
FTSE Russell’s rules identify categories that may be restricted, including some government holdings, controlling shareholder positions, cross-holdings, founder and director stakes, employee holdings subject to restrictions and shares under lock-up arrangements. The detailed thresholds and treatment depend on the methodology.
A holding is not excluded merely because its owner has not traded recently. The question is whether the methodology considers it available to public investors. Conversely, a share included in free float can remain in the same long-term portfolio for years.
This is why issuer disclosures matter. Annual reports, major-shareholder notifications, prospectuses and lock-up disclosures can reveal who owns a material stake and whether restrictions apply. The index provider then applies its published rules and review schedule rather than reading an investor’s intentions day by day.
Why a smaller float can magnify price moves
Price is set at the margin: by the orders that can meet now. If a large part of a company is held strategically, the pool from which active buyers and sellers can emerge is smaller. A sizeable order can therefore represent a larger fraction of the realistically tradable supply.
That mechanism can contribute to wider bid-offer spreads, thinner order books and sharper price changes, particularly in smaller companies. It is an inference about supply and demand, not a promise that every low-float share will be volatile. A low float can coexist with active trading, while a high-float company can be illiquid at a particular time or price.
The distinction matters because small-cap prices can move sharply for several reasons. Free float is one potential amplifier alongside limited analyst coverage, concentrated holders, smaller order books and news sensitivity.
Free float is not daily liquidity
Liquidity is the practical ability to buy or sell without causing a large price move or waiting excessively. It changes with order size, market conditions, news and the price a trader is willing to accept.
A 60% free float says 60% is deemed available under the chosen methodology. It does not say any of those holders want to sell today. Nor does it reveal the quantities resting at each price in the order book. Ten thousand shares may be tradable in principle but only a few hundred may be offered near the last traded price.
Index providers can also apply a separate liquidity screen using trading data. The existence of that separate test is the clearest warning against using free float as a substitute for liquidity. One is an ownership and investability adjustment; the other evaluates trading activity under its own rules.
Why methodology details matter
A free-float figure is not a timeless physical fact. It is the output of definitions, disclosure evidence, thresholds, bands and review timing. Corporate actions, placements, lock-up expiries and changes in major holdings can alter it.
FTSE Russell reviews investability weights and handles corporate events according to published guides. Another index provider can make different classifications. Two data services may therefore show different figures without either having counted today’s sell orders.
For an investor, the useful response is to read the definition beside the number. Ask who produced it, when it was reviewed and which holdings were excluded. A percentage without its methodology is less informative than it appears.
A practical small-cap check
- Confirm the issued or outstanding share count in current company disclosures.
- Identify major strategic, founder, government or cross-holdings.
- Look for lock-ups or other restrictions and their expiry terms.
- Read the index or data provider’s definition of free float.
- Keep full market capitalisation separate from free-float-adjusted value.
- Check recent volume, spread and order-book depth separately before trading.
- Consider the size of the intended order relative to normal activity.
The final two checks are essential. A methodology may classify shares as investable while the market cannot absorb a particular order at the displayed price.
Repeat the check after a placement, lock-up expiry or major-holder announcement. The denominator, the restricted holdings and the tradable market can change at different times.
A second fictional example: float versus the order book
Return to the company with 100 million issued shares, a £2 price and a 60% illustrative float. Sixty million shares are therefore included in the free-float calculation. Now imagine the visible sell orders near £2 total only 20,000 shares and normal daily volume is 150,000.
An investor wanting 10,000 shares might trade without moving far through the available offers. An investor wanting two million cannot assume that 60 million “free-float shares” can be bought at £2. Most are held by investors who have placed no sell order. To attract sellers, the buyer may need to wait or offer successively higher prices.
The reverse applies to a large sale. A published float of 60% does not create bids. If nearby buyers want only small quantities, the seller can receive progressively lower prices. The relevant constraint is market depth at the time and the size of the order, not just the ownership classification.
This example uses invented figures and does not describe a particular company. Its point is structural: float defines a broad investable pool, whereas the order book shows the much smaller pool currently willing to trade at stated prices.
The useful conclusion
Issued shares describe the equity created, market capitalisation values that equity at a market price, and free float estimates the portion available to public investors under a methodology. None of those figures alone tells you how many shares can be traded immediately without moving the price.
Friday moves from a supply constraint to a legal one: changing one cryptoasset into another can count as a disposal even though the transaction never produces cash.