Plain answer
The bid-offer spread is the gap between the price available to a seller and the price charged to a buyer. Here is how to turn it into pounds.
You buy an investment and immediately see a small loss. Nothing important has happened to the company. No new economic data has arrived. The market has barely moved.
The explanation may be the bid-offer spread: the gap between the price available to a seller and the price charged to a buyer.
That gap is one reason a price displayed on a screen is not always the price at which you can trade.
The plain-English answer
The bid is the price at which buyers are currently willing to buy from you. The offer, sometimes called the ask, is the price at which sellers are currently willing to sell to you.
The offer is normally higher than the bid. If you buy at the offer and immediately sell at the bid, you trade on both sides of the spread, so the full spread comes out of your result, even if the two quotes have not moved.
The spread is therefore a transaction friction. It is not usually shown as a separate fee on a receipt, but it affects the result in pounds.
If you first want the wider reason these quotes exist, read why financial markets exist. A market brings potential buyers and sellers together; it does not guarantee that they agree on one executable price.
A 99p–101p example
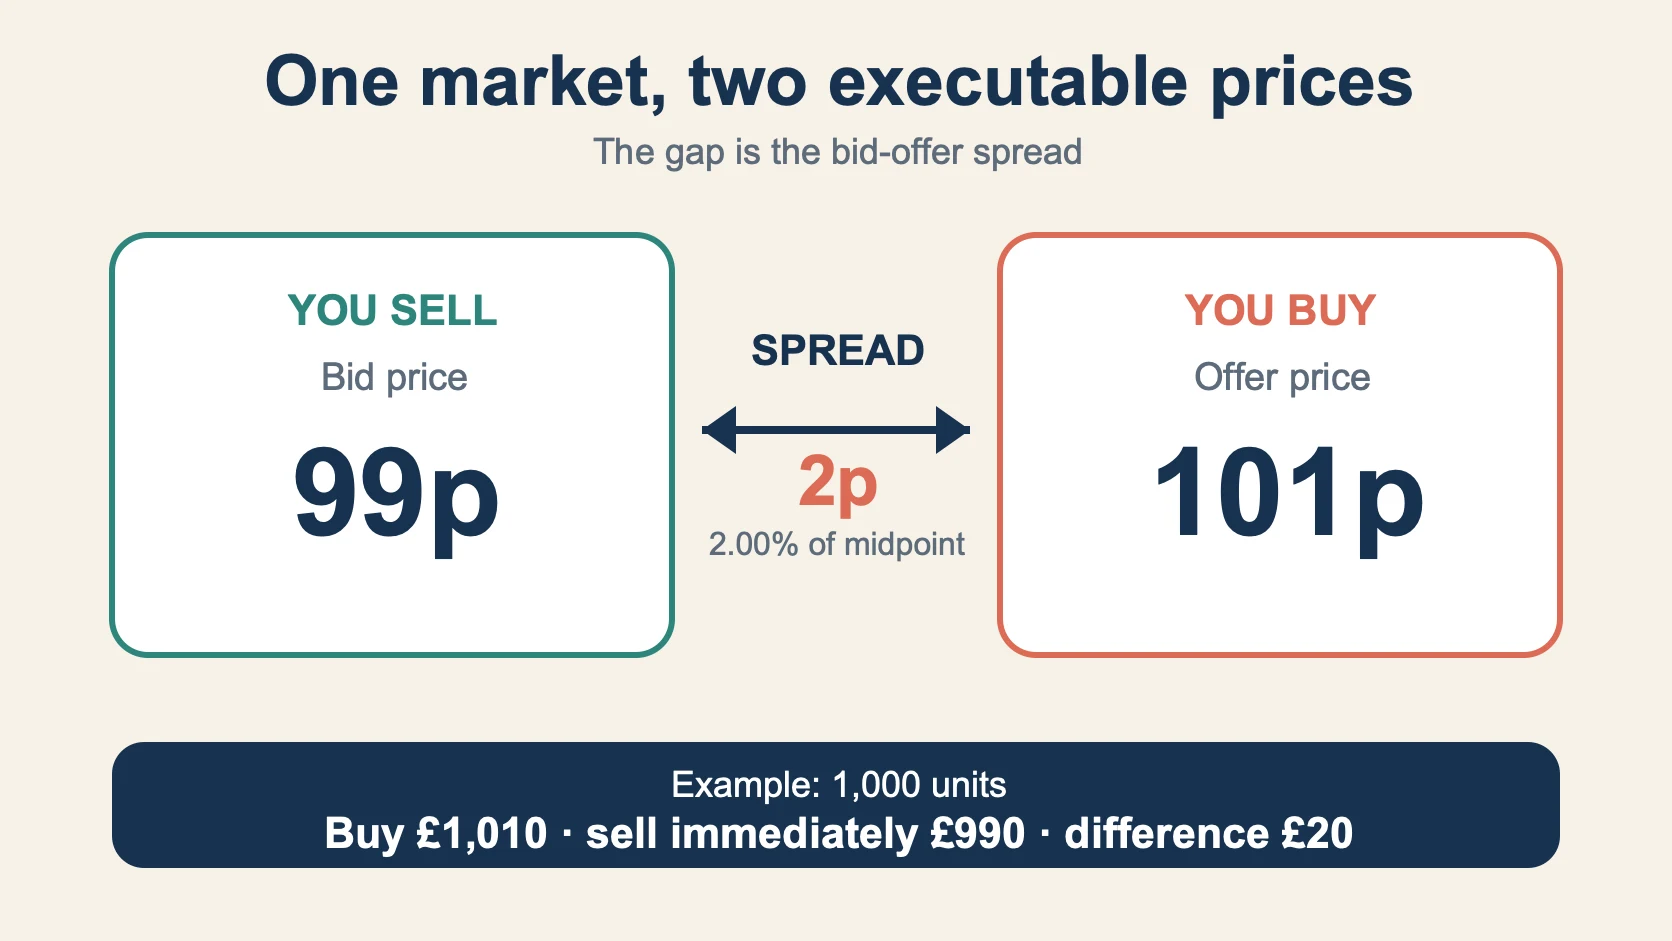
Suppose a share is quoted:
- bid: 99p
- offer: 101p
- midpoint: 100p
The spread is 2p. Expressed as a percentage of the 100p midpoint, it is 2%.
Buying 1,000 shares at 101p costs £1,010 before any separate dealing charge or tax. Selling them immediately at 99p returns £990. The immediate round-trip difference is £20.
The position may therefore appear to begin about 1.98% below the cash paid, even though the midpoint remains 100p. That percentage uses the £1,010 purchase cost as its base; other services may display performance differently.
The useful discipline is to state both the formula and the denominator. “The spread is 2%” and “the immediate loss is about 1.98% of the purchase cost” describe related but different calculations.
Trade Friction Visualiser
Turn a quoted difference into pounds. Choose the spread or stop-loss view, change the assumptions and see which part of the outcome comes from execution friction.
Quote and quantity
Excludes commission, tax, currency conversion, market depth and later price changes.
Trigger and available price
Shows a sell-stop example and excludes the earlier gain or loss, spread, commission, tax and partial fills.
Formulas and limitations
Spread percentage = (offer − bid) ÷ midpoint. Immediate spread friction = (offer − bid) × quantity. Stop execution difference = (trigger − execution) × quantity. These are simplified educational calculations, not live prices or a forecast of execution.
Use the Spread tab to change the bid, offer and quantity. The visualiser deliberately excludes commission, tax and later price movement so that the spread remains visible. It is a teaching tool, not a live quote or trading recommendation.
Why is there a spread at all?
A trade requires somebody willing to take the other side. Buyers prefer lower prices; sellers prefer higher ones. Orders collect at different prices, producing a gap between the best available bid and offer.
Professional market makers may quote both sides and take the risk that prices move before they can offset a position. Other markets match orders submitted by participants. Either way, immediacy has a cost: accepting the current quote is different from waiting in the hope that somebody accepts yours.
The London Stock Exchange’s trading-system guide describes an electronic order book in which eligible orders are prioritised by price and then time. That helps explain why “the price” is better understood as a set of available orders than as a single fixed fact.
Why some spreads are wider
Spreads tend to reflect how easy and risky it is to trade. They can widen when:
- few buyers and sellers are active;
- the investment trades infrequently;
- the order is large relative to normal activity;
- important news creates uncertainty;
- the underlying market is closed; or
- prices are moving quickly.
A heavily traded large-company share may have many competing orders close together. A small or rarely traded security may have only a few. The displayed best prices can then be farther apart, and a sizeable order may need to trade at several price levels.
That last point is called market depth. The best offer might apply to only 500 shares. An order for 5,000 may consume that quote and continue at higher offers. A simple spread calculation is useful, but it cannot show the full cost of an order larger than the quantity available at the best price.
Midpoint, last trade and executable price
Investment pages often display one prominent number. It may be:
- the last price at which a trade occurred;
- the midpoint between bid and offer;
- a delayed price;
- an indicative valuation; or
- the price from another venue.
None necessarily equals the quote available for your order now.
Edition 2 explained why market price can differ from value. This lesson adds a second distinction: even the market price can mean different things. An estimate of fair value, a last trade and an executable quote answer different questions.
Market order or limit order?
A market order prioritises dealing at the best prices currently available. It may execute quickly, but the final price can move if the market changes or the order consumes several price levels.
A limit order sets the worst price the trader is willing to accept. It controls price but not completion: the order may fill partly or not at all.
This is a trade-off, not a puzzle with one correct order type. Speed, price certainty and likelihood of execution cannot always be maximised together.
The FCA’s best-execution rules reflect that broader reality. Depending on the client, order and circumstances, firms consider factors including price, costs, speed, likelihood of execution and settlement, size and nature. “Best” does not always mean the highest bid or lowest offer viewed in isolation.
Three ways to read a quote more carefully
Before dealing:
- Find the bid and offer. Do not rely only on the large headline number.
- Convert the spread into pounds. Multiply the per-unit gap by the quantity, while recognising that depth can change the result.
- Check the order instruction. Decide whether completion or a price boundary matters more, and understand how the provider handles that order.
Also identify separate commission, tax, currency conversion and platform charges. The spread is one friction, not the entire cost.
The useful conclusion
A new holding can start at a loss because buying and selling occur on different sides of the market. The bid-offer spread makes that difference visible.
The key habit is to stop asking for “the price” and ask a more useful question: Which price can I actually transact at, for this quantity and this instruction?
Tomorrow’s lesson follows the order after a market moves: why a stop-loss can execute at a different price.
Sources
- London Stock Exchange: Guide to the Trading System, January 2026 — order-book operation and price/time priority.
- FCA COBS 11.2A: Best execution — execution factors and firms’ duties.
- FCA DISC 6: Costs and charges disclosure — transaction-cost context.
This article and visualiser provide general financial education. They do not use live market data or recommend an investment or order type.